Listen to Interview with Harnav and Gagan(Famous wedding Photographers from Punjab) by Davinder Kaur 24 #np on #SoundCloud
Kya aap panchavi pass se tez hain

I think I will do nothing for a long time but listen,
And accrue what I hear into myself … And let sounds contribute toward me.

Python Learning
Python is not a difficult language. This is the easiest computer programming language to learn. Here, I’m sharing few resources from where you can learn python even if you are not aware of the basic concepts of programming. This is the resource from where you can easily learn this language from scratch. I learned Python language from Coursera.
At Coursera, you can take following courses to learn python by Dr. Chunk:
- Python for everybody (Getting started with Python)
- Using Python to Access Web Data
- Using Databases with Python
- Python Data Structure
For practice, you will get hands on and also chapter-based assignments. I have completed my first course and continued with the second. Spending 4 to 5 hours regularly to learn something new through such courses can give you the best confidence to start working on your project. All the best.
Changing Colours in OSM Map
Our Previous Work
- Creating our own OSM tile Server
- Adding one more Zoom Level
- Online Map Editing using ID Editor
- Changing Colours of roads in Map by editing file OSMBright.xml (which is wrong approach)
This is what we have done earlier. Today, we will talk about the right approach to change the colours of the roads, widths of the roads and much more. Now, we will study every concept related to OSM in details, whether it is its database ‘postgresql’ or XML files or any other technology used in this like mapnik, mod_tile, OpenLayers.osm etc. So, we will cover every topic in details and definitely with some good examples. For now, we will start with editing colours of map roads. For this, you need to know about the following-
- pallette.mss file
- roads.mss file
- project.mml file
- OSMBright.xml file
- Carto
All the files are stored in the folder OSMBright, address could be /usr/local/share/maps/style/OSMBright/.
So, let’s study each one by one:-
- pallette.mss – For style customization like colours and fonts, we can use this file. I wanted to change the colours of primary roads and residential roads, so I made changes in this file and after rendering got the colours of roads of my choice.
- roads.mss- This file contains line widths of roads at every zoom level. We can make changes here if we want to change the widths of roads. Also, it uses the colour ids we created in the palette.mss file.
- project.mml- This file contains all the information of data stored in the postgresql database. We have given dbname ‘gis’ to our database where details of every line, area and land is stored in file format .mml. This file contains the IDs we used in .mss files to define the properties of roads, buildings etc.
- Carto- Carto converts the .mml file into Mapnik XML file. It adds the Carto stylesheet with the every entity.
- OSMBright.xml- This is final output mapnik XML file generated with the following command- $ carto project.mml > OSMBright.xml. Now, this file is rendered to show maps on the browser with the attributes of our choice.
Changes I made-
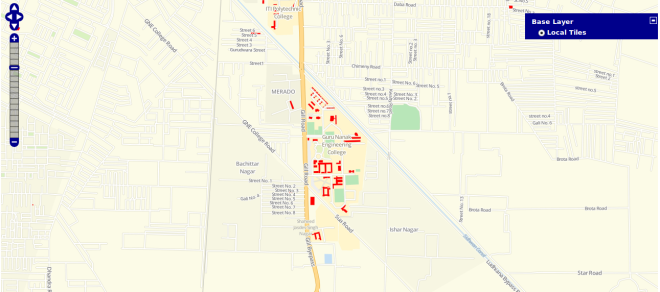
I made some changes in the pallete.mss file to create a map having primary and secondary roads of green colour and all the residential roads with black colour. Also changed building colours to red. Then I recreated the OSMBright.xml file and performed rendering to see the output on the browser. You can see the changes hee in the following screenshots-
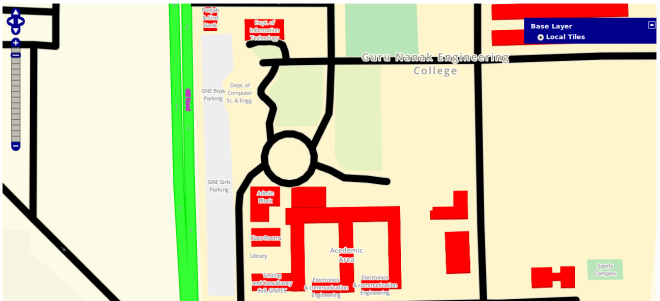
If, you want more details, feel free to ask any question and stay tuned for future posts.
Full of Positivity – W.W.
I celebrate myself, and sing myself,
And what I assume you shall assume,
For every atom belonging to me as good belongs to you.
————- capture ————-
I have heard what the talkers were talking, the talk of the beginning and the end,
But I do not talk of the beginning or the end.
There was never any more inception than there is now,
Nor any more youth or age than there is now,
And will never be any more perfection than there is now,
Nor any more heaven or hell than there is now.
Urge and urge and urge,
Always the procreant urge of the world.
ਬੇਖੌਫ਼
ਸਾਰੀ ਉਮਰ ਮੈਂ ਡਰ-ਡਰ ਹੰਢਾ ਦਿੱਤੀ
ਹੁਣ ਦੀ ਘੜੀ ਬੇਖੌਫ਼ ਹੋਕੇ Jeeਣ ਨੂੰ ਜੀਅ ਕਰਦਾ॥ ਰਹਾਓ ॥
-ਕੌਰ
Sometimes with one I love
Sometimes with one I love I fill myself with rage for fear I effuse unreturn’d love,
But now I think there is no unreturn’d love, the pay is certain one way or another
(I loved a certain person ardently and my love was not return’d,
Yet out of that I have written these songs).
-W.W.
I want you happy
I feel happy when I see happy people around me.
I feel sad when I see sad people around me.
I feel helpless when I see people in pain.
I feel restless when I see people in a race.
And I feel dead when I fail to bring a smile on their face.
@Kaur
Change all buildings Color to Red
To change all buildings Color to Red, open /usr/local/share/maps/style/OSMBright/OSMBright.xml file and then
1. In line 966 where style name building is defined (Style name=”buildings” filter-mode=”first”), change the fill colour to red i.e. #FF0000 at every zoom level.
2. Change it for polygonsymbolizer, buildingSymbolizer etc.
3. Then perform re-rendering, if needed remove the old tiles in <code>/var/lib/mod_tile </code>folder and re-generate all.
4. Now, check the result on the browser.
Increase zoom level in OSM
To increase one more zoom level in OSM, follow the given steps:-
1. Edit renderd.conf file located at /usr/local/etc/ and add this-
MAXZOOM=20
Now, save the file and close.
2. Edit the file /var/www/html/osm/slippymap.html
In line number 37 and 44 set numZoomLevels: 20;
In line number 39 add
map.setCenter (new OpenLayers.lonLat(659688.852138, 5710701.2962197), 20);
3. Re-render the tiles. The zoom level will be increased.
